REILink Calculizers™:
Intelligent Analysis for Every Strategy.
Elevate your real estate investments with unparalleled precision. Our advanced Calculizers™, powered by the REILink Insights Engine™, go beyond mere numbers to offer deep validation, contextual interpretation, risk warnings, and actionable optimization strategies for every deal.
Not just calculators. Not just analyzers. It's Your Unfair Advantage.
Discover the Calculizer™ Suite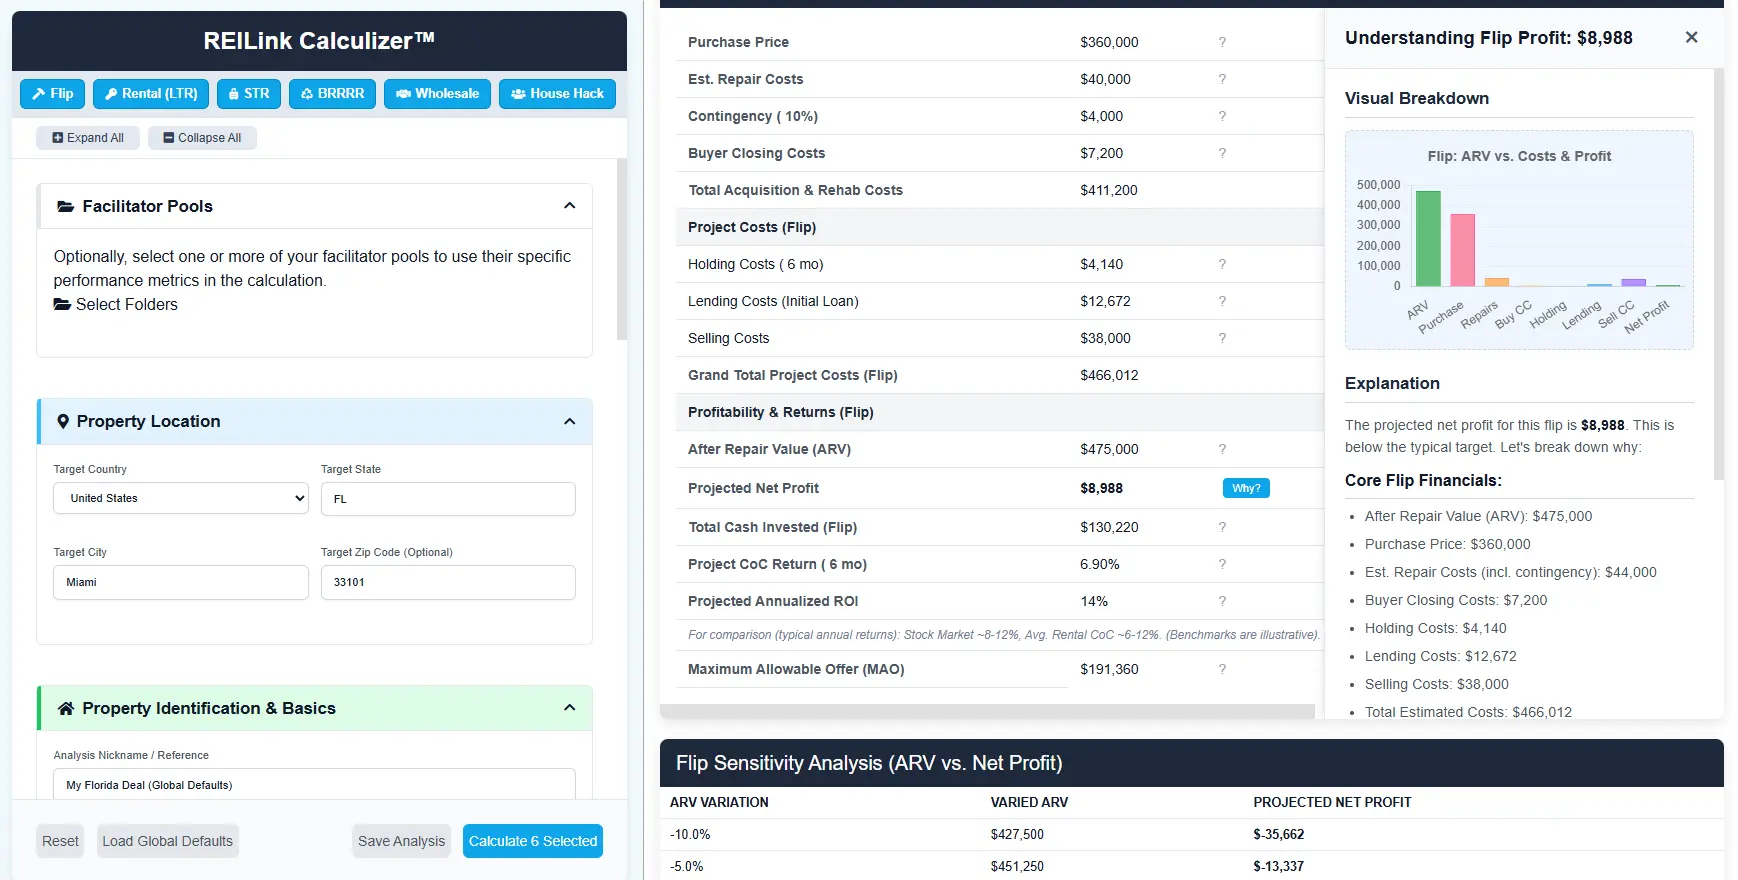
The Calculizer™ Revolution
In today's complex market, surface-level numbers are a recipe for disaster. REILink Calculizers™ were engineered from decades of investment experience to provide the deep, intelligent analysis sophisticated investors demand. We transcend basic math, offering tools that validate your assumptions, interpret market signals, warn of hidden risks, optimize deal structures, and contextualize every metric. Powered by our proprietary REILink Insights Engine™, each Calculizer™ empowers you to see the complete picture, meticulously align deals with your strategic goals, and invest with unwavering, data-backed confidence.
Your Specialized Calculizer™ Toolkit
From quick flips to complex BRRRRs, dive into each strategy with a tool precision-engineered for its unique financial DNA and common pitfalls.
Flip Calculizer™
Engineer Profit, Mitigate Risk, Maximize ROI.
The Flipping Game: Precision Pays Dividends
Flipping demands meticulous financial planning. One miscalculation in ARV, rehab costs, or holding time can turn a promising profit into a significant loss. Our Flip Calculizer™ brings institutional-grade precision to your fingertips, helping you identify profitable opportunities and avoid costly mistakes.
Key Capabilities & Insights:
- Dynamic MAO Calculation: Instantly see your Maximum Allowable Offer adjust as you fine-tune repair estimates, holding costs, and desired profit, ensuring you never overpay.
- Intelligent "Why?" Insights & "Fix It" Scenarios: If projected profit is low or a cost seems dangerously high (e.g., "Repairs are 45% of ARV!"), click "Why?" for a detailed cost-driver analysis, visual charts breaking down expenses, and actionable "Fix It" scenarios to model improvements like "Model with 10% lower repairs" or "Explore a 5% higher ARV."
- Comprehensive Profit Metrics: Clearly analyze Net Profit, Gross Profit, ROI, and Cash-on-Cash Return, benchmarked against your goals and typical market performance.
Rental Calculizer™
Unlock LTR & STR Potential with Deep Analysis.
Building Enduring Wealth: LTR & STR Mastery
Whether targeting consistent Long-Term Rental cash flow or maximizing Short-Term Rental revenue, success hinges on accurate projections and robust risk management. Our unified Rental Calculizer™ provides unparalleled depth for both LTR and STR strategies, from initial investment to long-term performance.
Key Capabilities & Insights:
- Sophisticated LTR/STR Modeling: Tailored inputs for vacancy, management fees, seasonal STR rates, guest turnover costs, furnishing amortization, platform fees, and detailed operating expense categories.
- "Why?" Diagnostics for Cash Flow & DSCR: Negative cash flow? DSCR too low for financing? Click "Why?" to get visual breakdowns of income vs. expenses (OpEx pie charts, NOI vs. Debt Service bars), identify problem areas (e.g., "Property taxes are 35% of OpEx!"), and model "Fix It" scenarios like rent increases or OpEx reductions.
- Full KPI Suite & Long-Term Projections: Instantly calculate CoC Return, Cap Rate, NOI, DSCR, OER, GRM. Project multi-year performance, including after-tax cash flow, equity growth, loan amortization, and IRR.
BRRRR Calculizer™
Amplify Your Capital, Accelerate Portfolio Growth.
The BRRRR Method: Your Infinite Returns Engine
The Buy, Rehab, Rent, Refinance, Repeat strategy is the investor's formula for rapid portfolio scaling by recycling capital. Success hinges on precise execution at each stage—from purchase and value-add rehab to tenant stabilization and the critical cash-out refinance.
Key Capabilities & Insights:
- End-to-End BRRRR Lifecycle Modeling: Accurately analyze each phase: acquisition & rehab financing (including hard money options), detailed holding costs during renovation, rental stabilization (LTR or STR), and the crucial cash-out refinance.
- "Why Is Cash Left In High?" Insights: If you're not pulling out enough capital to achieve your "infinite return" goal, click "Why?" for a detailed breakdown of ARV vs. total project costs, LTV impacts, and "Fix It" scenarios to model higher LTVs, increased ARVs, or lower initial costs. See a visual of cash in vs. cash out.
- Optimize Refinance & Post-Refi Performance: Model various LTVs, interest rates, and closing costs. Instantly see the impact on cash-out, cash left in, and the new rental's cash flow, CoC (on cash remaining), and DSCR.
Wholesale Calculizer™
Maximize Fees, Ensure End-Buyer Appeal, Close Faster.
Wholesaling: The Art of the Quick Turn & Smart Spread
Master the velocity game of wholesaling. Our tool helps you structure deals that are irresistible to your cash buyers while maximizing your assignment fee. Analyze ARV, repair estimates from the buyer's perspective, and your fee to find the win-win scenario quickly.
Key Capabilities & Insights:
- End-Buyer Profitability Analysis: Instantly see the deal from your buyer's viewpoint. Does it offer them a compelling CoC return or profit margin after their estimated repairs and costs?
- "Why Is My Fee Squeezed?" Insights: If your desired assignment fee makes the deal unworkable for buyers (e.g., "End-buyer CoC drops to 8%!"), get detailed explanations and "Fix It" suggestions to model a lower fee or demonstrate how a lower purchase price from the seller is needed.
- Buyer Pool Attractiveness: Get feedback if your deal parameters align with typical cash buyer demand in the area.
House Hack Calculizer™
Live For Less, Invest For More, Build Equity Faster.
House Hacking: Your Launchpad to Financial Freedom
Drastically reduce or even eliminate your housing costs by renting out portions of your owner-occupied property. It's a powerful strategy to build equity rapidly, gain landlord experience, and free up capital for future investments, often with favorable owner-occupant financing.
Key Capabilities & Insights:
- Precise Net Living Cost Analysis: Understand your true monthly out-of-pocket expense (or profit!) after all rental income from tenants and shared property costs are accounted for.
- "Why Is My Cost Still High?" Analysis: If your net living cost isn't as low as desired, click "Why?" for a detailed breakdown of PITI vs. tenant rent contributions, OpEx impacts, and "Fix It" scenarios to model increased tenant rent or reduced overall property expenses.
- Savings vs. Renting & Full Rental Potential: Quantify your monthly savings compared to traditional renting and see the property's cash flow potential if it were fully rented as a standard investment.
Comparative Analysis Engine™
Unbiased Strategy Optimization for Any Deal.
One Property, Multiple Paths: Find YOUR Optimal Strategy
A single property often holds potential for diverse investment strategies. Should you execute a quick flip for immediate profit, establish a long-term rental for steady cash flow, or perhaps a high-yield STR? Making the optimal choice isn't just about running numbers for one strategy—it's about rigorously comparing them apples-to-apples against your unique financial goals, risk appetite, and time commitment. Our Comparative Analysis Engine™ does exactly that.
Key Capabilities & Insights:
- Holistic Side-by-Side View: Simultaneously analyze a deal through the lens of Flipping, LTR, STR, BRRRR, Wholesaling, and House Hacking. See every critical metric for every viable strategy in one comprehensive, easy-to-digest table.
- Goal-Driven Alignment Scoring: The REILink Insights Engine™ intelligently weights normalized metrics (profit, cash flow, risk, capital, speed, effort) based on YOUR active "Strategic Preset" (e.g., "Maximize Cash Flow", "Minimize Risk") and your personal strategy preference ratings. The result is a clear "Alignment Score" (0-100) for each strategy, pinpointing which path best matches your specific objectives for *this* deal.
- Clear Recommendations & Visualized Trade-Offs: Receive a top strategy recommendation backed by detailed rationale. Understand the crucial trade-offs (e.g., higher profit vs. higher risk) against other viable options, often visualized with multi-dimensional radar charts that instantly show each strategy's unique strengths and weaknesses.
The Intelligence Behind the Numbers
All REILink Calculizers™ are powered by our sophisticated REILink Insights Engine™.
This isn't just about calculations; it's about intelligent interpretation. The REILink Insights Engine™:
- Validates Inputs Against Reality: Flags unrealistic assumptions by comparing your entries to dynamic market data and common sense financial guardrails, preventing GIGO (Garbage In, Garbage Out). For example, it might warn if your ARV is 25% above recent comps or your repair budget is unusually low for the property type.
- Delivers Contextual "Why?" Explanations: When numbers look off (e.g., negative cash flow, low profit) or a key threshold is breached (e.g., DSCR < 1.2), click "Why?" to get a detailed drill-down. This includes root cause analysis, visual charts breaking down the components (like an OpEx pie chart), and actionable "Fix It" scenarios to model improvements instantly.
- Personalizes to Your Goals: Factors in your saved investment preferences (e.g., "Maximize Cash Flow", "Minimize Risk") and strategy ratings to provide truly aligned recommendations, not just a one-size-fits-all answer. It tells you which strategy *best fits you* for *this deal*.
- Enables True Strategy Comparison: Normalizes diverse financial metrics (dollars, percentages, risk scores) onto a common 0-100 scale, allowing you to objectively compare different investment paths for the same property and choose with confidence, often visualized with a strategy radar chart.
Visualize Your Path to Profit & Clarity
Our Calculizers™ transform complex data into intuitive visuals: cost breakdowns in "Why?" panels, cash flow projections, ROI sensitivity analyses, and strategy comparison radar charts empower you to make informed decisions quickly.
Profit/Cost Waterfall
Cash Flow Over Time
Strategy Alignment Radar
Stop Guessing. Start Calculizing™.
The REILink Calculizer™ suite, supercharged with our Insights Engine™, "Why?" explanations, and "Fix It" modeling, is your unfair advantage in today's market. Gain the clarity and confidence to optimize every deal and accelerate your real estate success.
Unlock Your Deal Potential →